In today’s highly competitive environment, each managed service provider (MSP) must not only maintain but boost its operational efficiency. Being efficient is the key to expanding your business, improving client satisfaction, and achieving financial success.
With these benefits in mind, we at MSPbots created new features that will enable ConnectWise or Autotask users to track their overall productivity and serviceability.
Are your KPIs and SLAs being met? Check out these five widgets:
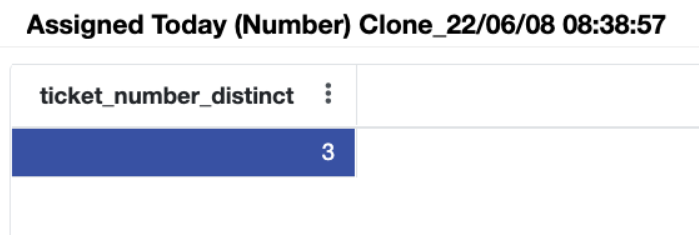
Assigned Today (Number)
First is a widget that allows a manager to keep track of all of the successfully dispatched tickets for the day. The Assigned Today grid widget shows the total number of assigned jobs that your technicians are currently working on or have completed.

Client Dashboard Template
Technicians and clients count on managers to guarantee that priorities are being organized correctly. With this expectation, managers must always be two steps ahead, and the Client Dashboard Template report will assist them with this task.
The report will provide answers to questions like:
- What tickets for high-priority customers are still available?
- Which clientele are the most inundated with requests?
- What are the most common types of tickets that the team receives?
- What extra resources should be assigned to a certain client or ticket?
Managers can also shift gears as needed because they’ll see all the details at a glance:
- Client’s total number of open tickets
- The number of tickets waiting per customer
- Open tickets per technician
- For the previous 14 days, open tickets can be broken down by issue type
- For the previous 14 days, how many times tickets were opened by contact
- For the previous 14 days, the number of tickets that have been opened vs. closed

Service Ticket KPIs
Beyond the Client Dashboard Template, reviewing your business’s average response time can aid managers in delegating resources and improve the amount of time it takes to resolve your client’s issues.
The Service Ticket KPIs report includes a dashboard featuring these ten widgets:
- Number of tickets Opened today
- Number of tickets Closed today
- Number of New tickets today
- Number of Assigned tickets today
- Number of tickets Resolved today
- Number of tickets In Progress today
- Number of Stale tickets
- Number of tickets Waiting on Customer
- Number of tickets Open by Priority
- Number of tickets Open by Type
- Number of tickets opened vs closed for the last 14 days

[Sea-Level] % of Tickets Met Response SLA by Priority (Previous Month)
When the MSP continuously meets the client’s committed service standards, the client’s trust in the MSP rises. The [Sea-Level] percent of Tickets Met Response SLA by Priority (Previous Month) widget can help establish these expectations better.
This grid-type widget groups the number of tickets that met the Response SLA and the portion of tickets that met the SLA by Priority.
Managers and even MSP owners can use this data to determine their response rate and, if necessary, take proactive steps to improve it.

Resource Utilization (Current Month)
We also built a dashboard to keep MSPs from under-performing or over doing it and risk burnout. The dashboard identifies where “perfect” efficiency is, statistically speaking, to assist managers and project owners with resource management and workload planning.
The Resource Utilization (Current Month) is a column-type widget that displays the utilization percentage per resource for the current month. This widget helps your MSP increase utilization and profitability.

Wondering how MSPbots can supercharge your business? We came out of beta last January, and ever since, this MSP for MSPs has grown into a sophisticated, powerful platform that uses business intelligence to automate and improve your MSP.
Want to learn more about our other features? Got an operational problem that needs solving? We’re all ears! Sign up for free or schedule a demo today to get started. Reach us anytime at support@mspbots.ai for inquiries.
